
Ipinaliwanag ko sa nakaraan kong article ang tungkol sa konsepto ng bullish market. Ngayon, akin namang tatalakayin ang tungkol sa konsepto ng bearish market.
Ang bearish market ay isang yugto na kung saan ang inaasahan o expectation ay ang presyo ng stock ay pababa. Dito ay mababa ang investor confidence level at inaasahan ang pagkalugi ng mga investors.
Ano-ano ang halimbawa ng mga chart patterns na sensyales ng isang bearish market?
1. Double Top
Ang double top ay binubuo ng dalawang magkasunod na peaks na halos magkapareho na may katamtamang trough o decline sa gitna gaya ng nasa chart sa ibaba.
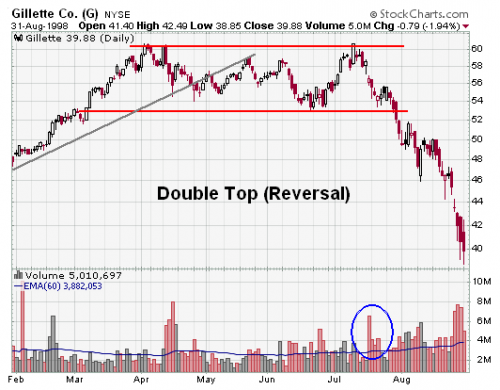
Bago lumitaw ang double top, ito ay kinakikitaan ng matibay na uptrend sa nagdaang mga buwan. Ang unang peak ay nagpapakita ng pinakamataas na point sa kasalukuyang trend. Ang susunod ay ang trough o pagbaba ng halos 10 to 20% ng unang peak. Pagdating sa volume ng trough, hindi ito kinakikitaan ng significant na pagbaba. Ang pangalawang peak ay kinakikitaan ng mababang volume at ito’y tumatama sa resistance level. Ang pagitan ng unang peak at pangalawang peak ay kadalasang nasa una hanggang tatlong buwan. Kadalasang magkasing taas ang una at pangalawang peak pero pwede rin kung ang pangalawang peak ay nasa 3% ng unang peak. Ang pagbaba o decline pagkatapos ng pangalawang peak ay nasa 3% ng unang peak. Ang pagbaba o decline pagkatapos ng pangalawang peak ay kinakikitaan ng biglang pagtaas ng volume.
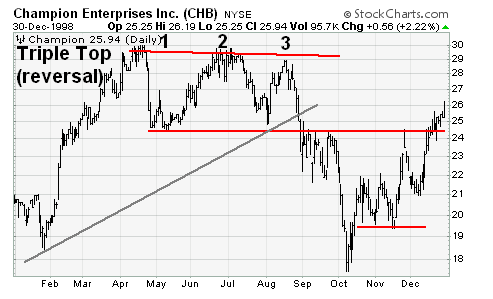
2. Triple/ Multiple Top
Ang triple o multiple top ay binubuo ng tatlong magkakasunod na magkakasingtangkad na sinusundan ng break na mas mababa kaysa sa support. Ang pattern na ito ay kadalasang nabubuo sa loob ng tatlo hanggang anim na buwan.
Bago magsimula ang triple top ay kakikitaan ito ng uptrend formation gaya ng nasa larawan sa ibaba. Susundan na ito ng tatlong highs na halos magkakaparehas at well spaced. Pagdating sa volume, ang kabuuang volume sa triple top formation ay kadalasang pababa. Minsan, ang volume ay tumataas pagdating sa pangatlong high pero pagkatapos nito ay ang pagtaas o pagdami ng volume. Ang decline na mkikita pagkatapos ng formation ay bumababa sa support level at nagiging pangalawang resistance gaya ng nasa chart sa ibaba.
3. Head & Shoulders
Ang head and shoulders pattern ay binubuo ng left shoulder, head, right shoulder, at neckline gaya ng nasa chart sa ibaba.
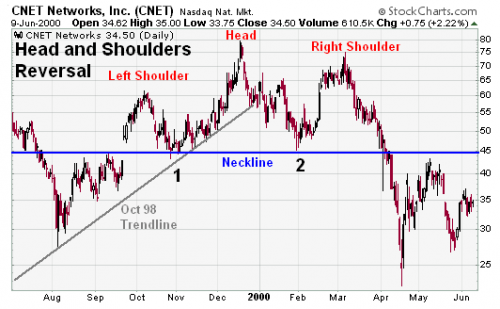
Ang unang bahagi bago ang head and shoulders ay ang tinatawag na uptrend o ang papataas na formation. Ang left shoulder naman ay bumubuo ng pinakamataas na point sa nakalipas na uptrend. Pagkatapos ng trend nito ay ang pagbaba na hindi lumalagpas sa neckline o ang horizontal line na kumukonekta sa point 1 at point 2. Ang point 1 ang pagtatapos ng left shoulder at pagsisimula ng ng head samantalang ang point 2 ang kumokonekta sa pagtatapos ng head at pagsisimula ng right shoulder gaya ng nasa larawan. Ang susunod rito ay ang pagtaas at ang pagbuo sa tinatawag na head o ulo ng pattern. Ito ang pinakamataas na punto sa formation na sinusundan naman ng pagbaba rin na hindi lalagpas sa neckline. Ang susunod rito ay ang pag-angat ulit na magiging right shoulder ng chart pattern. Ang peak nito ay mas mababa kung ihahambing sa head. Ang pagbaba o lowest point ng right shoulder ay lumalagpas sa neckline level na senyales ng isang bearish market. Pagdating naman sa volume, ang left shoulder ay kakikitaan ng volume na mas mataas kaysa sa head. Pagdating naman sa pagbaba o decline ng right shoulder, ito’y kakikitaan ng pagtaas o pagdami ng volume na nagrerepresenta ng mas maraming pagbenta na senyales ng bearish market.
Technical analysis is a method of examining past market data to help forecast future price movements. Using different tools, indicators, and charts, traders can spot important price patterns and market trends, and then use that data to anticipate a market's future performance.
While fundamental analysis involves analysing the characteristics of a company in order to estimate its value, technical analysis uses a different approach. It doesn't consider the "value" of a company or a commodity at all. In contrast, technicians (or chartists) are just interested in the price movements in the market.
Technical analysis is based around a market's price history, rather than the fundamental data such as earnings, dividends, news, and events. The belief is that price action tends to repeat itself and the patterns can be identified and used to define a market's trend.
Despite all the fancy and exotic tools it uses, technical analysis actually only looks at supply and demand in a market in an attempt to determine what direction, or trend, will continue in the future. In short, technical analysis attempts to understand the emotions in the market by studying the market itself, as opposed to its components. If you understand the benefits and limitations of technical analysis, it can give you a new set of tools or skills that will enable you to be a better trader or investor.
In analyzing a chart of trading prices, indicators measure changes in market sentiment — bullish, bearish, etc. Indicators are just patterns on a chart or arithmetic calculations whose value depends on how you use them.
Moving averages are lagging indicators help gauge the direction of the current trend of a market. Trend Lines are important for identifying and confirming trend direction. The Relative Strength Index (RSI) is a momentum oscillator that measures the strength and speed of a market's price movement by comparing current price to past performance. Fibonacci retracements can help traders identify significant price points and predict levels of support and resistance.
But these are not perfect, and not 100 percent effective. Many times, your indicator will fail and you’ll take losses in technical trading. However, don’t take it personally. Comfort yourself knowing that using indicators minimizes losses, but indicators never eliminate all losses.
Sa susunod kong article ay akin namang ipapaliwanag ang mga Candlestick chart patterns na makakatulong sayong malaman kung bearish o bullish ba ang merkado.


